
Over the past seven years, New York’s cap on local property tax levies has generated billions of dollars in savings for homeowners and businesses, compared to previous trends. The cap has been especially effective in restraining school property taxes, which have long been the largest and fastest-growing component of New York’s tax burden.
The cap is flexible: its baseline “allowable levy growth factor” of 2 percent or the rate of inflation, whichever is less, is modified by locally variable exclusions and exceptions, and can be overridden by a 60 percent vote of district residents. Nonetheless, advocates of higher school spending contend the law is unduly restrictive. “The tax cap … hurts our poorest districts the most, placing the most severe limits on their ability to raise funds and punishing parents and other taxpayers in low-wealth districts who try to provide more funding for their children,” says the head of the statewide teachers’ union.
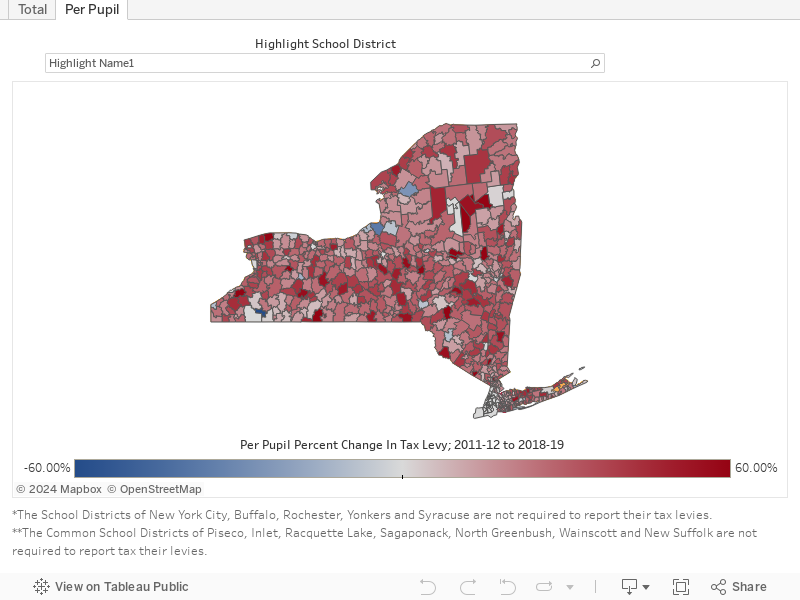
A different story emerges from comparison of tax and spending data from 2011-12 to 2018-19. As illustrated in the charts and tables that follow:
- Spending has risen faster—and taxes have increased more slowly—in low-wealth “high need” districts.
- Adjusted for enrollment, the average annual tax hike exceeded 3 percent in all but the poorest districts.
- Thanks largely to exceptions for tax base growth, voter-approved debt payments and a one-time teacher pension cost spike in 2013-14, average taxes for all districts have increased 23 percent faster than the headline “growth factor” would have permitted since 2011-12.
See interactive school district map at the end of this report for more detailed information.

Under the tax cap law, the allowable levy growth factor has been pegged at 2 percent three times—in 2012-13 and 2013-14, and again in 2018-19. The lowest growth factor was near-zero—just 0.12 percent in 2016-17. Based on the growth factor alone, school tax levies could have risen by a maximum total of 10.9 percent, or about $2 billion, during the cap’s first seven years. The actual increase, as detailed in the table below, has been 13.5 percent, or more than $2.5 billion.
Added growth was made possible by exclusions including increased taxable values attributed to new construction, worth up to $663 million of added taxes, and a one-time spike in teacher pension costs in 2013-14—now worth up to $343 million in added levies statewide, including subsequent compounded growth, even though pension contribution rates have receded to pre-2012 levels. The cap calculation also excludes taxes needed to pay debt service on voter-approved capital projects, which came to $670 million in 2018-19, according to the state comptroller’s office. Overrides have been less of a factor in boosting levies: in more than 4,600 school budget vote cycles since 2012-13, there have been 186 override attempts, 112 of which were approved.
As detailed in the table below, the tax cap worked most effectively to hold down taxes in low-wealth, “high need” districts, which are also favored by the state aid formula. Higher-wealth districts in the low- and average need categories have had to exert significantly greater local tax effort to boost spending to higher rates, despite a roughly 8 percent decline in their enrollments since 2011-12.
 School District Property Tax Levies and Spending, 2011-12 to 2018-19
About the Author

You may also like


School’s Out Forever
Absenteeism was and remains particularly problematic for students in high school, Black and Hispanic students, and special education students. Read More

Learning Loss in New York During the Pandemic
Last Spring, students statewide in grades 3-8 sat for annual state assessments to measure proficiency in English language arts (ELA) and math. Read More

New York Property Tax Calculator 2021
New York’s property tax rates are generally among the highest in the nation. Specific property tax burdens vary widely throughout the state. Read More

Benchmarking New York 2021
To help New Yorkers compare certain basic fiscal measures for local governments, the Empire Center has calculated effective property tax rates and per-capita values for the spending, debt and tax levels throughout the state. Read More

Charging Forward: New York’s Costly Rush to Electrify School Buses
A new law requires New York State’s school bus fleet be entirely zero-emission by 2035. But it's unlikely the state can meet that deadline. Read More

What They Make
Local government is a labor-intensive business, and employee compensation is the single biggest element of most municipal budgets. Read More

Sticker Shock: The Impact of a ‘Single-Payer’ Health Plan on New York Taxes
Proponents of “single payer” health care are pushing New Yorkers to take a multi-billion-dollar leap of faith. Read More