

K-12 SOS is a pilot project of the Empire Center to inform parents, politicians, and decision-makers about the state of K-12 education in New York State. Determining why certain schools perform better than others is beyond the scope of this research. School size, proportion of economically disadvantaged students, per-pupil spending, and school type likely play a role in the performance of schools and districts. All data used in this report can be found in our K-12 SOS interactive database here.
Summary
New York State. New York spends $30,012 per student, more than any other state or country. Based on preliminary data, the number will approach $35,000 in 2025-26. This is approximately double the U.S. average, with little evidence of a corresponding increase in student achievement.
New York’s schools perform on par with the national average in Grade 4 reading, but trail behind in mathematics. In either case, New York is outperformed by states that spend significantly less to educate one pupil.
Albany City School District. In mathematics, Albany scores below the New York state average, with only 26 percent of students achieving proficiency compared to New York’s 52 percent. In English Language Arts (ELA), Albany also falls short, with an average proficiency rate of 28 percent, compared to New York’s 48 percent.
Out of 670 school districts surveyed, Albany ranks 626th in mathematics and 580th in ELA. The school district spends $28,088 per pupil and ranks 490th in spending.
Schools in Albany. Most schools in Albany perform below the New York average in ELA and mathematics. Only three schools have proficiency rates greater than the state average in ELA, and only four in mathematics.
New York State
New York State leads the nation in education spending, allocating $30,012 per student in fiscal year 2023—more than any other state and more than any other country. Preliminary data for 2025–26 shows the figure climbing toward $35,000 per student.
New York spends twice the national average and roughly one-third more than Massachusetts, which ranks first in K–12 education outcomes.
New York has consistently spent more on education than other states. Over the past 50 years, inflation-adjusted per-student spending grew by 170 percent nationwide—but in New York, it surged by 209 percent.
Moreover, student enrollment in New York’s public schools is steadily declining. Over the past decade, public school enrollment has fallen by 300,000 students—a 13 percent while charter schools have gained 80,000 students. If this trend continues and the overall student population shrinks, the per-student cost of education will keep rising unless meaningful reforms are made.
According to the Nation’s Report Card, in 2024, New York’s schools scored below the U.S. average in Grade 4 mathematics, both in average scores and in proficiency rates. New York had an average score of 234 compared to 237 for the U.S.
Notably, several states leading the Grade 4 Mathematics rankings, including Utah and Florida, are among the states with the lowest per-pupil spending.
From 1992 to 2009, New York’s student performance consistently surpassed the national average. However, Grade 4 math scores began to slip in the 2010s and declined sharply during the COVID pandemic—dropping 10 points in New York compared to a 5-point decline nationwide.
For Grade 8, New York’s performance was also mediocre: an average score of 271, compared to the U.S. average of 272.
New York’s schools rank slightly above the national average in reading yet fall well behind Massachusetts and New Jersey—two states that achieve stronger results while spending considerably less per student.
Notably, Utah ranks third in performance despite spending just $10,333 per student. Similarly, Mississippi—one of the nation’s poorest states—spends $12,093 and still delivers better results.
It is worth noting that New York’s Grade 4 Reading scores used to exceed the U.S. average in the 2000s. However, in the 2010s, New York’s scores began to dip and then fell sharply during the COVID epidemic. New York fell by 6 points while the U.S. dropped by an average of 3 points.
Similar dynamics can be observed in Grade 8 Reading average scores, except there was no such drastic dip during COVID.
Albany City School District
The Albany City school district spends $28,088 per pupil per year and ranks 490th, spending less than the average school district in the state of New York. Note, however, that due to differences in data sources, the numbers on spending among states, schools, and school districts cannot be directly compared to one another.
In mathematics, Albany scores below the New York state average, with only 26 percent of students achieving proficiency compared to the state average of 52 percent.
In English Language Arts (ELA) Albany also falls short, with an average proficiency rate of 28 percent, compared to the state average of 48 percent.
Out of 670 school districts surveyed, Albany ranks 626th in mathematics and 580th in ELA. Note that thresholds used to compare proficiency levels among states are different than proficiency levels used later in this report when comparing performance among New York’s school districts.
Schools in the Albany City school district
Most schools in Albany perform below the New York average in English Language Arts (ELA) and mathematics. Only three schools in the district have proficiency rates greater than the New York average in English Language Arts (ELA).
Similarly, only four schools have proficiency rates greater than the New York average in mathematics.
Determining why certain schools perform better than others is beyond the scope of this research. School size, the proportion of economically disadvantaged students, per-pupil spending, and school type are likely to play a role in schools’ overall performance.
Notes and clarifications
Per Pupil Expenditure (PPE) at the school district level includes central administrative costs for the operations of the school district. These costs are not included in the school’s PPE. Therefore, PPE at the school level is comparatively lower than at the school district level. Spending data for individual schools should not be compared to spending in school districts for the PPE data.
Main data sources
Per-pupil spending in the U.S.: United States Census Bureau, 2023 Public Elementary-Secondary Education Finance Data
Per-pupil-spending globally: National Center for Education Statistics, Education Expenditures by Country; Organization for Economic Co-operation and Development, Education at a Glance 2023
U.S. states’ performance in Grade 4 Reading and Mathematics: National Assessment of Educational Progress, Nation’s Report Card, 2024 State Profiles.
Per Pupil Expenditures for school districts collected from New York State Education Department (NYSED) School Data Fiscal Profiles 2022-23.
Proficiency Rates for School Districts collected from the 2022-23 NYSED School Report Card.
Proficiency rates and per-pupil expenditures for individual schools collected from the 2022-23 NYSED School Report Card.
Enrollment data for economically disadvantaged students are taken from NYSED.
Additional data sources
New York Per-pupil-spending for 2025-26: Empire Center, School Districts Plan To Spend Over $35K Per Student, Outpacing Inflation, based on New York State Department of Education, New York State Property Tax Report Card
Per-pupil-spending historic data: National Center for Education Statistics, Current expenditures per pupil in average daily attendance in public elementary and secondary schools, by state or jurisdiction
New York Public School Enrollment data: NYSED Information and Reporting Services
About the Author

You may also like

Switching to Electric Home Heating Could Add Thousands to Energy Bills
FOR IMMEDIATE RELEASE: ALBANY, N.Y. that heating an average home from October to March would cost approximately $790 with natural gas, compared with $1,100 with a heat pump and $3,300 with electr Read More
Hochul’s Energy Infrastructure Plan Gets the Diagnosis Right but Offers No Prescription
Editor’s note: Roger Caiazza is an adjunct fellow at the Empire Center. He has a long and deep private industry background in environmental regulatory analysis and compliance. His frequently updated personal blog on New York State environmental poli Read More

Poll: 64% of New Yorkers Back Eliminating the State Income Tax; 67% Say State Taxes Aren’t Delivering
Dissatisfaction spans party and regional lines as broad majorities rally behind sweeping tax reform
FOR IMMEDIATE RELEASE: ALBANY, N.Y. - New Yorkers are delivering a blunt assessment of the state’s tax system: 67% say they ar Read More
New Yorkers Want to Eliminate the Income Tax
Summary
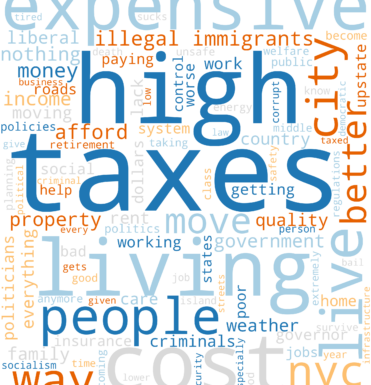
New Yorkers have reached a clear verdict: The state’s tax system is not delivering. A full 67% say they are not getting good value for their tax dollars, while 64% support eliminating the state income tax. Read More
SUNY Research Foundation Payroll Tops $400 Million
Payroll records for 8,401 employees of the Research Foundation for the State University of New York (RF SUNY) for fiscal year 2026 are , the Empire Center's government transparency website.
The Research Foundation is a private, nonprofit educational co Read More

Newly Retired NYC Firefighters Average Over $177k In Pensions
New York City firefighters and fire officers retiring last year after full careers were entitled to average annual pension benefits of $177,016, according to , the Empire Center's government transparency website.
Among the 499 new retirees with at leas Read More
New York Annual Household Electricity Costs Rise $270
FOR IMMEDIATE RELEASE ALBANY, N.Y. — New York’s average residential electricity price reached 29.90 cents per kilowatt-hour (kWh) in July 2026, the fifth highest in the nation and 63.3 percent Read More
Energy Data Bulletin September 2026
September 2026
Summary and Insights
Electricity. In June 2026, New York had the nation's fifth-highest residential electricity price at 29.49 cents per kilowatt-hour (kWh), 60.8 percent above the U.S. average. Prices d Read More