
New York State residents pay some of the highest local taxes in the nation. To help New Yorkers compare certain basic fiscal measures for local governments, the Empire Center for Public Policy has calculated effective property tax rates and per-capita values for the spending, debt and tax levels of counties, cities, towns, villages and school districts throughout the state,[1] excluding only New York City.
Derived from self-reported statistics gathered annually by the Office of the State Comptroller (OSC), the result is a database of measures that taxpayers can use as benchmarks for evaluating local governments.
Businesses have long known the benefits of benchmarking — measuring performance against standards set by competitors and peers. Benchmarks in isolation may say little about the quality of management or public services in different communities. However, by spotlighting differences and trends, the benchmarks in this report provide a framework for evaluation. And they provide goals for improvement for governments that need to compete more effectively to attract jobs and promote economic growth.
To further empower taxpayers to dig beneath the summary numbers, we continue to update our searchable online tool, which includes categorical breakdowns of spending for all 2,273 counties, towns, cities, villages, and school districts. Benchmarking NY at SeeThroughNY.net lets users rank and compare spending, tax and debt measures for local governments. With the 2021 fiscal year data, there are now fifteen years of data to explore in Benchmarking NY. Here are just a few examples of what the data show:
- Among the five largest cities outside New York City, Yonkers had the highest per-capita tax, spending, and debt burden. Albany had the highest effective property tax rate.
- Monroe County surpassed all mid-sized county governments in spending per-capita, while Oswego county’s near-zero debt per capita stood out in comparison.
- Oyster Bay, in Nassau County, had the highest spending, highest taxes and most debt among large towns. Its per-capita debt was nearly triple the average of its peers.
- The five highest-spending villages were all located on Long Island. The two villages of Ocean Beach and Saltaire spent $55,517 and $37,343 per capita, respectively, while all other villages spent less than $16,000. Upstate villages spent comparatively low amounts but had higher effective property tax rates.
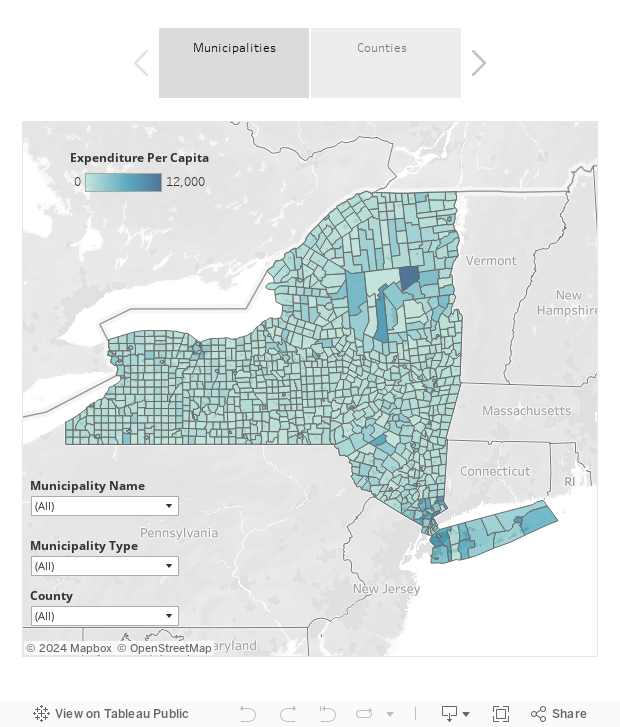
The maps below are color-coded according to jurisdictions’ level of spending per capita. By navigating the map, New York residents can view and compare various fiscal measures of municipalities and counties.
It’s all (sometimes) relative
Considered on a statewide basis, the data reflect vast differences in the cost of living and in property values between upstate and downstate regions.[2] Downstate communities have below-average effective property tax rates (but generally above-average per-capita taxes), while effective property tax rates tend to be highest upstate. Even allowing for such differences, comparing local governments reveals some significant differences among peers.
For example, the city of Glens Falls spends nearly twice as much as the similarly-sized city of Batavia. The Westchester County town of Cortlandt spends more than three times as much as the neighboring town of Haverstraw. And in Finger Lakes region, the city of Geneva’s per-capita debt is more than double the amount reported by the city of Canandaigua.
The data offer possible explanations for such disparities (among other things, Glen Falls spends heavily on community services and has a high debt service burden). Local officials can undoubtedly add some explanations of their own.
The purpose here is not to stigmatize, but to raise questions — and promote informed public discussion of the forces driving high local taxes in every corner of New York.
Shared services and consolidation are two ways to address high local spending and taxes, as the Empire Center has highlighted in two reports. Many cases of service-sharing arrangements involving different government entities throughout the state already exist. These arrangements can be expanded or serve as examples for other jurisdictions to emulate.
Still, consolidations and service-sharing arrangements are not cure-alls.[3] There’s no substitute for serious scrutiny of local governments’ bottom lines. Residents should demand appropriate actions to reduce costs, improve efficiency and make our communities more affordable and competitive. Benchmarking fiscal outcomes is a necessary first step towards achieving these goals.
On a per-capita basis, as shown below, towns have the lowest tax, debt and spending levels among local governments. Villages have the most debt, while counties collect the most in total taxes per capita — which reflects their control of sales taxes.
Methodology
Local governments and school districts report their expenditure, tax and debt data in annual reports compiled by OSC, which in turn posts the data online. Some local governments, mainly villages, fail to report their fiscal measures, making data unavailable for those jurisdictions.
To allow for more meaningful comparisons, the Empire Center recalculates the OSC data on taxes, debt and spending as per-capita values — i.e., relative to population. Property tax burdens are recalculated as effective rates, based on OSC estimates of assessed property values converted to full value based on equalization rates.
The Empire Center’s searchable database of tax and spending benchmarks for villages, towns, cities and counties has been posted at SeeThroughNY.net/benchmarking.
The database allows users to generate a single benchmark report, a comparison of several local governments, or a ranking of local governments on different measures of taxes, spending and debt. Users can also download the complete spreadsheets used to generate the reports.
ENDNOTES
[1] Because population breakdowns are not available for school districts and special districts, they are excluded.
[2] Compare local governments using the Benchmarking web app at SeeThroughNY.net/benchmarking.
[3] See, for example, Cox, Wendell Government Efficiency: The Case for Local Control. Albany, New York: The Association of Towns of the State of New York (2008).
About the Author

You may also like

34 MTA Workers Made $200K+ In Overtime In 2025
Thirty-four employees of the Metropolitan Transportation Authority (MTA) received more than $200,000 in overtime payments in 2025, as total annual pay surpassed half a million dollars for some, according to , the Empire Center’s governm Read More

Overtime on State Payroll Jumps 21%
104 employees made over $500k in 2025 total annual pay.
2,450 employees were paid more than Gov. Kathy Hochul's Read More

Seven Reasons Not To Raise Taxes in New York
Despite the robust growth of state revenues in recent years, many of New York's elected officials are pushing to further increase the tax burden on the state's residents and businesses.
Read More

Ninety New York Educators Receive $300k+ in Annual Pay
Ninety employees from New York’s school districts (outside New York City) received more than $300,000 during fiscal year 2025, according to , the Empire Center’s transparency website.
The public educator pay data are based on salary information rep Read More

NYC Employees Receive $300k+ in Overtime
Two New York City employees received more than $300,000 in overtime payouts, according to fiscal year 2025 , the Empire Center’s government transparency website. The city paid a total of $2.9 billion in overtime during fiscal year 2025. Read More

State Lawmakers Spend $268 Million on Legislative Operations
Spending by state lawmakers on office personnel and administrative costs varies widely, with some paying out nearly twice as much as others on their office operations, according to the most recent reported, posted to SeeThroughNY.net.
Read More
School Districts Plan To Spend Over $35K Per Student, Outpacing Inflation
School districts presenting budgets to voters on Tuesday, May 20, plan to spend an average of $35,012 per student, up 4.6 percent from the current school year, according to new state data.
Data collected by the state Education Departme Read More

Overtime on State Payroll Surges 11%
Twenty-three New York State employees collected over $200,000 each in overtime, according to posted today on SeeThroughNY, the Empire Center’s government transparency website. Read More