
K-12 SOS is a pilot project of the Empire Center to inform parents, politicians, and decision-makers about the state of K-12 education in New York State. Determining why certain schools perform better than others is beyond the scope of this research. School size, proportion of economically disadvantaged students, per-pupil spending, and school type likely play a role in the performance of schools and districts. All data used in this report can be found in our K-12 SOS interactive database here.
New York State
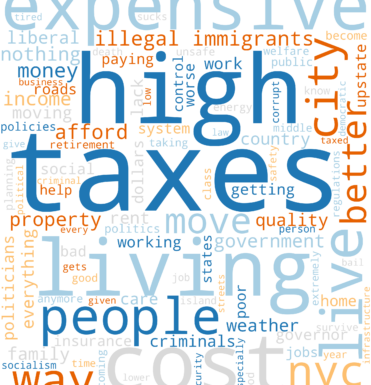
New York State leads the nation in education spending, allocating $30,012 per student in fiscal year 2023—more than any other state and more than any other country. Preliminary data for 2025–26 shows the figure climbing toward $35,000 per student.
New York spends twice the national average and roughly one-third more than Massachusetts, which ranks first in K–12 education outcomes
New York has consistently spent more on education than other states. Over the past 50 years, inflation-adjusted per-student spending grew by 170 percent nationwide—but in New York, it surged by 209 percent.
Moreover, student enrollment in New York’s public schools is steadily declining. Over the past decade, public school enrollment has fallen by 300,000 students—a 13% drop—while charter schools have gained 80,000 students. If this trend continues and the overall student population shrinks, the per-student cost of education will keep rising unless meaningful reforms are made.
Based on the Nation’s Report Card, in 2024, New York’s schools scored below the U.S. average in Grade 4 mathematics, both in terms of average scores and proficiency rates. New York had an average score of 234 compared to 237 for the U.S.
Notably, several states leading the Grade 4 Mathematics rankings, including Utah and Florida, are among the states with the lowest per-pupil spending.
From 1992 to 2009, New York’s student performance consistently surpassed the national average. However, Grade 4 math scores began to slip in the 2010s and declined sharply during the COVID pandemic—dropping 10 points in New York compared to a 5-point decline nationwide.
For Grade 8, New York’s performance was also mediocre: average score of 271, compared to the U.S. average of 272.
New York’s schools rank slightly above the national average in reading yet fall well behind Massachusetts and New Jersey—two states that achieve stronger results while spending considerably less per student.
Notably, Utah ranks third in performance despite spending just $10,333 per student. Similarly, Mississippi—one of the nation’s poorest states—spends $12,093 and still delivers better results.
It is worth noting that New York’s Grade 4 Reading scores used to exceed the U.S. average in the 2000s. However, in 2010s, New York’s scores began to dip, and then fell sharply during the COVID epidemic. New York fell by 6 points while the U.S. dropped by an average of 3 points.
Similar dynamics can be observed in Grade 8 Reading average scores, except there was no such drastic dip during COVID.
Main data sources
Per-pupil spending in the U.S.: United States Census Bureau, 2023 Public Elementary-Secondary Education Finance Data
Per-pupil-spending globally: National Center for Education Statistics, Education Expenditures by Country; Organization for Economic Co-operation and Development, Education at a Glance 2023
U.S. states’ performance in Grade 4 Reading and Mathematics: National Assessment of Educational Progress, Nation’s Report Card, 2024 State Profiles.
Per Pupil Expenditures for school districts collected from New York State Education Department (NYSED) School Data Fiscal Profiles 2022-23.
Proficiency Rates for School Districts collected from the 2022-23 NYSED School Report Card.
Proficiency rates and per-pupil expenditures for individual schools collected from the 2022-23 NYSED School Report Card.
Enrollment data for economically disadvantaged students are taken from NYSED.
Additional data sources
New York Per-pupil-spending for 2025-26: Empire Center, School Districts Plan To Spend Over $35K Per Student, Outpacing Inflation, based on New York State Department of Education, New York State Property Tax Report Card
Per-pupil-spdending historic data: National Center for Education Statistics, Current expenditures per pupil in average daily attendance in public elementary and secondary schools, by state or jurisdiction
New York Public School Enrollment data: NYSED Information and Reporting Services
About the Author

You may also like
Empire Center Poll: New Yorkers Prioritize Low Energy Prices and Have Little Appetite for Radical Climate Policies
FOR IMMEDIATE RELEASE
ALBANY, N.Y. — New Yorkers across political, geographic, age, and income groups oppose energy and climate policies that raise energy prices or force changes on homeowners, according to new Empire Center analysis Read More
Opinion Poll – Energy
Executive Summary
New York voters prioritize affordable energy and show limited support for energy and climate policies that could increase costs. The survey finds broad opposition to home-heating electrification and climate-related lawsuits aga Read More
The Attorney General’s MFCU SNAFU
Attorney General Letitia James' latest fight with the Trump administration focuses on New York's Medicaid Fraud Control Unit, a federally funded agency housed in James' office.
On T Read More

New York’s Electricity Prices Fourth Highest in the Country
New York households are paying the fourth-highest electricity prices in the country, according to the Empire Center's In April 2026, residential electricity prices in New York averaged 29.45 cents per kilowatt-hour - 56 percent above the national average Read More
Energy Data Bulletin June 2026
June 2026
Summary and Insights
Electricity. In March 2026, New York's average residential electricity price was 28.55 cents per kilowatt-hour (kWh). New York ranked 7th highest among the states and 50 percent above the Read More

Fourteen NYC Educators Receive Over Half a Million Dollars in Pensions
Fourteen retired New York City educators received more than $500,000 in pension benefits in 2025, according to , the Empire Center’s government transparency website.
The data was obtained from the New York City Teachers’ Retirement Read More
Healthcare Revelations in the Enacted Budget Financial Plan
The state financial plan published on June 10 disclosed key information about healthcare revenue and spending that lawmakers had not made public when approving the annual budget two weeks before.
Read More
Hammond Submits CDPAP Testimony to Congress
The Empire Center's Bill Hammond today submitted written testimony for a congressional hearing on healthcare fraud.
Hammond's testimony to the focuses on evidence of overuse and wa Read More