
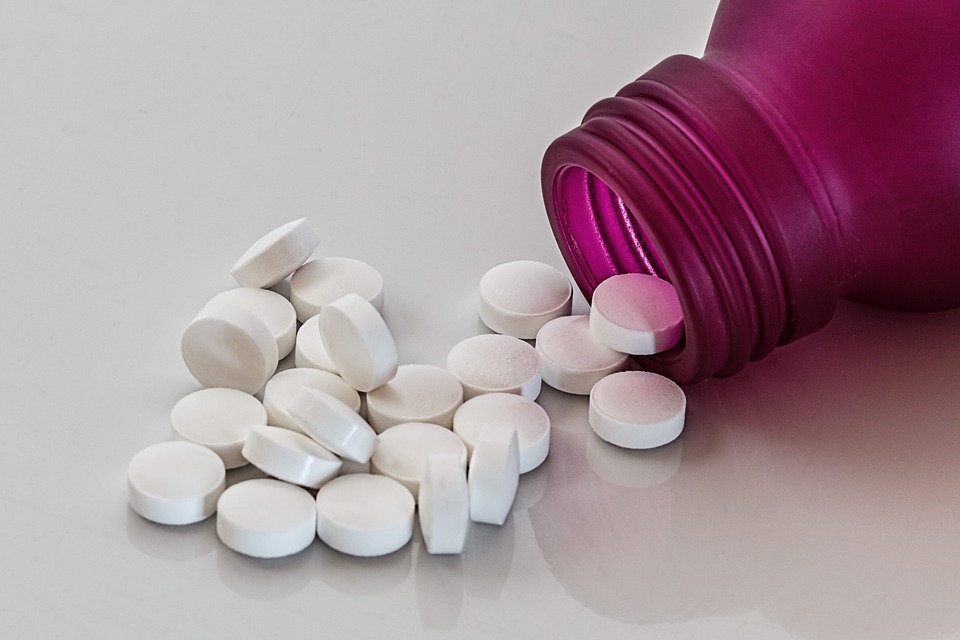
 Opioid prescribing rates vary widely across New York, with residents in some counties receiving three or four times as much of the potentially addictive pain relievers as in other counties, according to new data from the U.S. Centers for Disease Control.
The CDC found similar disparities across the country, and said they were a potential sign of doctors failing to follow up-to-date guidelines for when and how to use opioids for pain treatment.
Given associations between opioid prescribing, opioid use disorder, and overdose rates, health care providers should carefully weigh the benefits and risks when prescribing opioids outside of end-of-life care, follow evidence-based guidelines … and consider nonopioid therapy for chronic pain treatment.
In New York, the highest prescribing rate for 2015 was in the Catskill region’s Sullivan County, at 1,182 morphine milligram equivalents (MME) per capita. That was more than four times the rate in Brooklyn, which was lowest at 272 MME per capita.
The nationwide results were published last week in the CDC’s Morbidity and Mortality Weekly Report. The agency provided county-by-county details for New York at the request of the Empire Center.
The national average prescribing rate of 640 MME per capita is down about 18 percent since its peak in 2010, but still three times higher than it was in 1999.
New York’s prescribing rates are substantially lower than the U.S. average and also declining. The weighted average among the state’s counties (as estimated by the Empire Center) was about 539 MMEs per capita in 2015, down from 604 in 2010.
The five highest-prescribing counties were mainly small and rural and scattered across upstate: Sullivan, Chemung, Warren, Niagara, and Chautauqua. The five lowest-prescribing counties, with one exception, were larger and concentrated downstate: Kings, Queens, Westchester, Lewis, and the Bronx.
Among the 62 counties, 23 saw a significant decrease in the their prescribing rates from 2010 to 2015, 17 saw a significant increase, and 21 were stable, according to the CDC’s analysis. There was no available data for Hamilton County, the state’s smallest by population.
Interestingly, the counties that saw the biggest percentage increases were concentrated in the North Country: Lewis, Saint Lawrence, Franklin, Jefferson, and Clinton. The biggest percentage decreases were in Genesee, Yates, Chenango, Monroe, and Suffolk.
Nationally, the CDC found that prescribing rates tended to be higher in counties with a larger population of non-Hispanic whites, with a higher prevalence of diabetes and arthritis, and with higher rates of unemployment and Medicaid enrollment.
Within New York, however, prescribing rates do not seem to correlate with overdose deaths. Some counties, such as Staten Island, ranked high for both opioid prescriptions and overdoses (12th and 1st, respectively). But Warren County, with the third-highest prescribing rate in 2015, ranked 45th for its overdose rate in 2016. The Bronx, on the other hand, ranked 57th for prescribing but seventh for overdoses.
A chart of county-by-county prescribing rates and overdose deaths is available here.
About the Author

You may also like
The Attorney General’s MFCU SNAFU
Attorney General Letitia James' latest fight with the Trump administration focuses on New York's Medicaid Fraud Control Unit, a federally funded agency housed in James' office.
On T Read More
Healthcare Revelations in the Enacted Budget Financial Plan
The state financial plan published on June 10 disclosed key information about healthcare revenue and spending that lawmakers had not made public when approving the annual budget two weeks before.
Read More
Federal Suit Traces Medicaid Fraud to the Top of NYS Government
The Trump administration's latest salvo against Medicaid fraud takes aim at a different kind of target – two high-ranking New York officials along with a major state contractor.
A Read More

Healthcare Highlights in the New State Budget
Governor Hochul's focus on affordability seems to have skipped over the healthcare portions of the new state budget.
The deal finalized May 27 Read More

Lawmakers Consider Hiking Fees for Filling Prescriptions
UPDATE: The proposal discussed below passed the Assembly Friday evening by an unofficial vote of 133-0. Having previously been approved by the Senate, the bill will head to Governor Hochul's desk for her signature or ve Read More
Budget Deal Reportedly Earmarks $100M for 1199 and Extends MCO Tax
As Governor Hochul and legislative leaders rush to finalize the overdue state budget, outlines of some healthcare-related deals have begun to emerge from the closed-door negotiations.
Read More

Albany Wavers on Shutting Down a Medicaid Racket
As Washington threatens to crack down on fraud and abuse in New York's Medicaid program, state legislators are doing their best to demonstrate why federal intervention is needed.
A Read More

Getting to the Bottom of the 340B Drug Discount Boondoggle
Some of New York's largest and most prosperous hospitals are reporting rapidly growing amounts of revenue from pharmacy sales – most of it apparently flowing from a controversial drug discount program known as 340B. Read More