

New York’s total average tax burden has reached the highest level on record for the Empire State, according to an analysis of Tax Foundation data by the Manhattan Institute’s Empire Center for Public Policy.
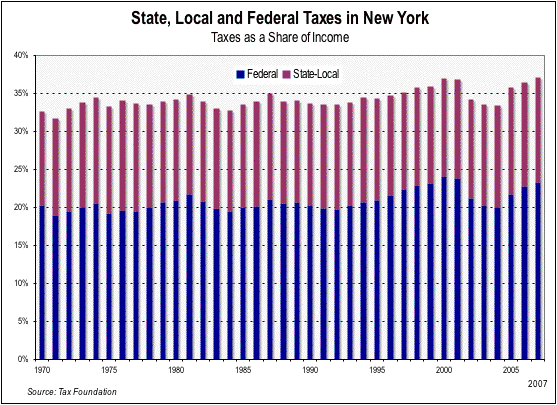
The latest Tax Foundation estimate shows the combined federal, state and local tax bite on New York residents and firms this year will come to 37.1 percent of their personal income. By this measure, New York’s burden is exceeded only by neighboring Connecticut’s, where taxes average 38.3 percent of income. The national average is 32.7 percent.
New York’s total tax is computed as the sum of a state and local taxes, which amount to 13.8 percent of personal income, and federal taxes, which total 23.3 percent of income. On the Tax Foundation’s scale, New York’s state and local burden ranks third, after Maine and Vermont; the federal burden in the state ranks sixth highest.
The highest previous combined tax burden in New York was 37 percent in 2000. It was 36.5 percent last year – but as recently as a decade ago, it had never topped 35 percent. The Tax Foundation data series only goes back to 1970; however, since effective federal, state and local tax burdens were much lower in earlier years, it is probably safe to say that the 2007 figure represents an all-time high. The long term trend is illustrated below.
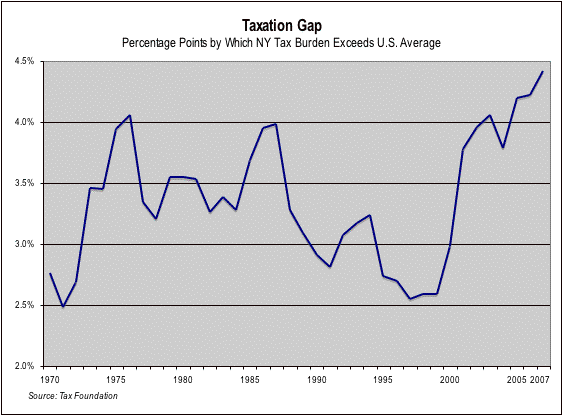
The gap between NY and the national average has also grown over time; back in 1970, the total federal, state and local tax burden in NY was 2.8 percentage points above the national average; now it’s 4.4 percentage points above average. Changes in the “taxation gap” between New York and the nation as a whole are shown in the chart below.
The measurement challenge
How do tax burdens compare among states? The question is not as simple to answer as it may sound. Relative tax levels can vary depending on how they are measured.
Census Bureau data on state and local tax collections are the starting point for most comparisons. But total collections are obviously misleading — because larger states will always collect more than smaller states. One way of adjusting for different sizes of states is to compare taxes relative to population. However, since taxes also reflect property values and incomes, measuring on a “per-capita” basis will tend to make the tax burden look heaviest in wealthy states with lots of expensive real estate (like New York)
Measuring taxes as a share of personal income in each state adjusts the relative burden in a way that allows for a more accurate comparison of the economic burden of taxation. Yet the personal income measure can be skewed by the extent to which states like New York export much of their burden in the form of income taxes on out-of-state commuters and sales taxes paid by visitors. Counting these “exported” taxes can make a state’s tax burden look heavier.
The Tax Foundation’s state and local tax measure tries to produce the best comparable measure by adjusting the Census data to exclude taxes paid by out-of-state residents. A further adjustment is made by adding federal tax data and allocating it by state. This also is the basis for the Tax Foundation’s annual estimate of each state’s “Tax Freedom Day,” which was May 16 in New York this year.
New York’s rising tax burden is due to a number of factors. First and foremost, the state and federal governments are heavily dependent on income taxes paid by high-income households, which are relatively numerous in New York. Record real estate and investment gains have pushed up income tax collections from these individuals. New York also is home to a large concentration of profitable corporations, whose corporate tax payments have been rising. Rising real estate values have also pushed up property assessments, contributing to the rise in property tax collections.
About the Author

You may also like

What They Make 2026: North Country
Lewis County employees held nine of the North Country's ten highest-paid local government positions in fiscal year 2025-26, most of them physicians and medical staff, . Jeffery Hellinger, a Lewis County employee, was the highest paid, at $265,978.
Read More
What They Make 2026: Mohawk Valley
Eight local government employees in the Mohawk Valley had gross pensionable earnings of more than $200,000 in fiscal year 2025-26, . Four were county elected officials and three were Oneida County correction officers. The highest paid was Christina Pea Read More
What They Make 2026: Southern Tier
Mary Nobilski, a Steuben County employee, was the Southern Tier's highest-paid local government employee in fiscal year 2025-26, at $309,582, . She was the only local employee in the region paid more than Governor Hochul's $250,000 salary.
Stat Read More
What They Make 2026: Central New York
Syracuse police officers held all ten of the highest-paid local government positions in Central New York during fiscal year 2025-26, . John Tassini was the highest paid, at $282,861.
Statewide, the 179,222 employees of New York's counties, citi Read More
What They Make 2026: Finger Lakes
Rochester police officers held eight of the ten highest-paid local government positions in the Finger Lakes region during fiscal year 2025-26, . Robert Hill was the region's highest-paid employee, at $314,040.
Statewide, the 179,222 employees o Read More
What They Make 2026: Western New York
Erie County deputy sheriff Simon Biegasiewicz was Western New York's highest-paid local government employee in fiscal year 2025-26, at $305,077, followed by Buffalo firefighter Daniel Bossi at $300,488, . They were the only two local employees in the r Read More
What They Make 2026: Capital Region
An Albany police officer, Willie Flack, was the Capital Region's highest-paid local government employee in fiscal year 2025-26, at $279,370, . Police officers in Albany, Schenectady and Troy and the Town of Colonie held six of the region's ten highest- Read More
What They Make 2026: Mid-Hudson
Town of Ramapo police officers held four of the five highest-paid local government positions in the Mid-Hudson region during fiscal year 2025-26, led by Daniel Hyman at $421,338, the second-highest local government pay in the state, .
Statewide Read More