


City governments throughout New York “are stressed and have to work hard to keep their fiscal houses in order,” says a new report from the office of state Comptroller Thomas DiNapoli. Unfortunately, while it includes some useful new data and compelling findings, DiNapoli’s report on “new fiscal realities” facing local governments focuses almost exclusively on the recession and declining revenues. The spending side of local budgets is implicitly treated as fixed and immutable.
The report doesn’t let localities (including counties) off the hook for contributing mightily to their own problems. For example, it notes that previous audits by the comptroller’s office have identified at least 17 local governments “that have such poor financial systems that they do not know their current financial condition or are unaware of how their actual expenditures compares to what they have previously budgeted.” These localities, including Rockland County and the Village of Freeport in Nassau County, have had declines in fund balances or actual deficits totaling more than $68 million in fiscal 2011-12.
The comptroller’s staff sensibly recommends that localities “institute effective multiyear financial planning processes to identify structural imbalances between revenues and expenditures, and allow them to set long-term priorities and goals.”
Improved accounting aside, the report is long on diagnosis and short on remedies. It notes that localities need to reduce spending, but it doesn’t delve at all into the drivers of spending — which, for municipalities and schools, in particular, consists mainly of employee compensation. Indeed, aNew York Times article on the report says that, in an interview with the paper, “Mr. DiNapoli said local governments were facing a ‘perfect storm’ of financial pressures — including diminished state aid, falling property values and sluggish collections of sales tax.” No mention of rising salaries and benefit costs.
By focusing on financial developments since 2008, the report ignores longer-term trends that brought local governments to this situation. For example, based on data collected by the comptroller but not reviewed in his report, here’s a chart of city government expenditures and revenues from 1998 (the earliest posted online) through 2010 (the latest year available).
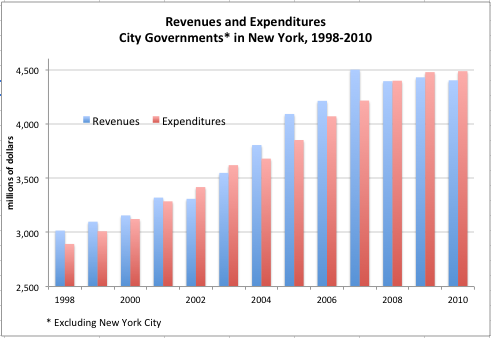
Note that city revenues surged ahead of expenditures during the final phase of the 1990s boom (1998-2001), dipped briefly in 2002, and then surged again from 2003 through 2007. After roughly breaking even in 2008, cities spent more than they collected in 2009 and 2010, the comptroller’s data indicate. The total increase in spending by cities from 1998 through 2010 averaged 3.7 percent, while their revenues increased 3.2 percent. Inflation during this period averaged 2.5 percent.
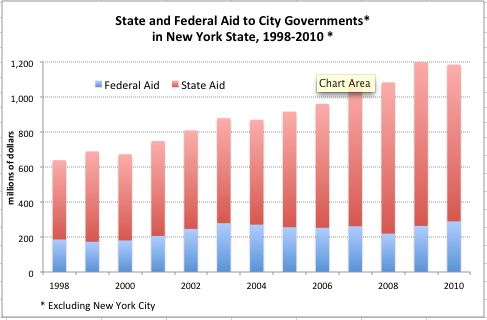
Speaking of revenues, report also notes that state aid has declined since 2008-09. But in the longer term, state aid and federal aid combined (but mainly state aid) to cities increased significantly, as shown below.
Most New York cities — especially upstate cities — impose very high property tax rates, and the comptroller’s report notes that some are moving “dangerously” close to their constitutional tax limits. “Generally, (cities) have been losing populations for decades, along with declining or stagnant property assessments, higher poverty rates than surrounding towns, and older and decaying infrastructure,” the report notes.
Given all these factors, these cities desperately need to find ways to deliver services more cost-effectively. They don’t have a revenue problem but a spending problem. And thanks to state laws like the Triborough Amendment, they don’t have as much flexibility as they need to adjust their budgets — which, again, consist mainly of employee compensation costs — to reflect new economic realities.
You may also like

Hochul’s Pandemic Review Contract Included a Gag Clause, Records Confirm
The authors of a report on New York's pandemic response are barred from discussing their findings with media under a provision of their contract with Governor Hochul's office, records obtained by the Empire Center confirm. Read More

DiNapoli audit diagnoses the Health Department’s chronic conditions
A penetrating new audit of the Health Department's pandemic response makes clear that problems at the agency run much deeper than its misreporting of nursing home deaths. Read More

New York’s State Share of Medicaid Spending is Due to Jump 22 Percent This Fiscal Year
The state share of Medicaid spending is projected to jump 22 percent under the recently approved state budget, an unusually steep one-year jump for what is already one of New York's biggest expenditures. Read More

State Tax Receipts Strong Again in November, But Jobs Recovery Remains Slow
New York State's tax receipts in November were a whopping $800 million above Governor Cuomo's projections for the month—further evidence that the current-year budget gap is probably much smaller than Cuomo has been claiming.
Meanwhile, however, priva Read More

Counties’ Medicaid role dwindles
New enrollment numbers from the state-run health insurance exchange confirm a trend relevant to budget talks in Albany: The role of local governments in signing people up for Medicaid is smaller than ever. Read More

A lesson on apprenticeships
The raw politics behind giveaways to building trade unions were on display last week in Troy, a city outside Albany. Read More

Cuomo’s $1.7B Medicaid mulligan
This year's state budget came with a hidden asterisk: In the final throes of his negotiations with legislative leaders, Governor Cuomo quietly postponed a month's worth of Medicaid payments from the last week of March to the first week of April – shifting $1.7 billion in spending from one fiscal year to the next. Read More

DiNapoli blocks the union exit
State officials are still working overtime to shield government unions from the impact of the U.S. Supreme Court decision in Janus v. AFSCME. This week, Comptroller Thomas DiNapoli’s office has issued new guidelines effectively giving the unions the first say on efforts by employees to opt out of union dues payments. Read More