

For a second consecutive decade, New York State’s “domestic migration” loss of residents to other states was the largest in the country as a percentage of its population, as documented in a new Empire Center report. Our negative net rate of total migration, after taking account of immigrants moving into New York from foreign countries, was among the worst of any state — putting us in the company of such troubled states as Louisiana, Michigan, Illinois and Rhode Island.
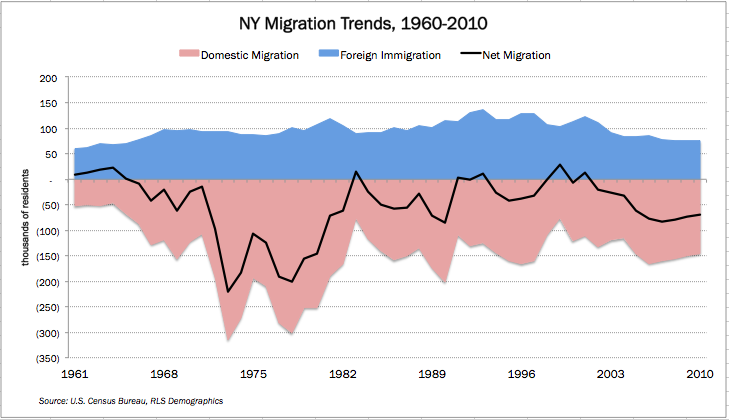
The chart below illustrates New York’s 50-year migration trend, including the foreign and domestic numbers as well as a line tracing the net migration level. Note that horrible ’70s show: New York’s loss was greatest during the decade following the enormous run-up in state and local spending and taxes under Governor Nelson Rockefeller in the 1960s, and improved following the efforts to cut taxes in the 1980s and 1990s. For more details, see the report.
You may also like

As Immigration Slowed, New York’s Population Hit a Wall in 2025
New York State added just 1,008 new residents last year as its post-pandemic recovery ground to a near standstill, newly released Census Bureau estimates show.
The population increa Read More

Pandemic-driven population shift within NYS winds down — and flight to rest of US continues
New York City and its suburbs accounted for most of New York State’s during the second year of the pandemic, according to the latest county-level estimates from the Census Bureau.
for the 12 months ending last July 1 indicate the city’s populatio Read More

NY’s pre-Covid tax base drain confirmed in new comptroller’s report
New York was a net loser of income tax filers to other states even in the five years leading up to the pandemic disruption of 2020 Read More

Here’s a tool for sorting out New York’s local population trends
Federal census data for 2020 indicate New York State's total population increased by 823,147 residents, or 4 percent, since 2010. Population gains over the last decade were concentrated in urban areas and inner suburbs, while most rural communities saw th Read More

Remote Threat
Remote work and a more mobile professional class will increase the speed and scope of New York's ongoing out migration. Read More

NY’s getting a bit grayer
The elderly share of America's population has been growing—but New York is graying more slowly. That’s among the trends to be gleaned from the latest U.S. Census estimates of population distributions by age group at the state and county level. Read More

Jobs grow further apart in NY
Newly revised data from the state Labor Department indicate New York's regional economic performance gap has grown larger in the last year.
On a year-to-year basis, the state gained 103,900 private-sector jobs in January—a growth rate of 1.3 percent at a time when the U.S. as a whole was growing by 2.1 percent, according to the state Labor Department's monthly jobs report. Read More

The (continued) graying of NY
Compared to national and statewide averages, rural counties in upstate New York have a much larger share of residents aged 65 and older, the latest Census Bureau estimates show.
The 65+ population was 15.3 percent of the U.S. total as of mid-2016, according to census data released today. The Empire State as a whole was just a hair above the national average, with 15.4 percent of New Yorkers falling into the age category that demographers generally tag as elderly. Read More